
WORLD SITUATION
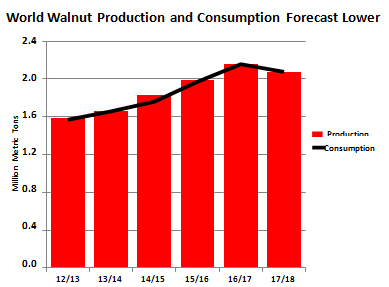
World walnut production and consumption for 2017/18 are each forecast lower to 2.1 million tons in- shell basis on lower output in China and the United States. Global exports, dominated by the United States, are expected up 6 percent to 755,000 tons. World ending stocks are forecast to continue sliding lower for three consecutive years after peaking in 2014/15.
CHINA
The production is forecast down 6 percent to 1.0 million tons due to weather-related shortfalls in top producing regions. A spring frost in Yunnan province affected many walnut trees in higher altitude orchards, while drought conditions in Shanxi province during fruit-set caused walnuts to drop from older trees. Output from other regions is expected to expand due to area expansion and favorable weather. Imports are forecast to rebound sharply to 70,000 tons on rekindled demand from the food ingredient and snack food industries.
USA
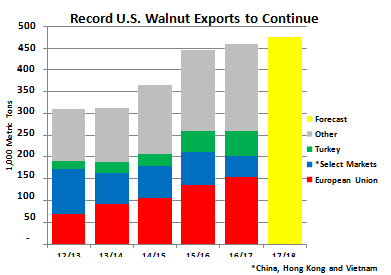
The production is forecast down 5 percent to 590000 tons as lower yields more than offset greater area. The season began with adequate chilling hours and record amounts of rain during the winter and spring months. There were reports of orchards being saturated for several weeks which resulted in a compromised root system. A higher- than-average insect problem was also reported. During the excessive heat waves over the summer, growers applied sunburn prevention materials. Consumption is expected to drop 21 percent to a more normal 150,000 tons following last year’s massive jump. Exports account for a substantial portion of output and are forecast 3 percent higher to a record 475,000 tons primarily on rebounding shipments to China, Hong Kong, and Vietnam. Ending stocks are expected to tighten for a third consecutive year.
EUROPE
The production is forecast down slightly to 115,000 tons on modest reductions in France and Romania, while Spain is flat. Consumption is expected nearly unchanged following several years of strong growth. Demand is driven by snack foods and cooking ingredients on the retail side and pastries on the industrial side. Imports are expected up 3 percent to a record 260,000 tons.
CHILE
The production is forecast to remain elevated at 120,000 tons following last year’s surge, with nearly all exported. Key markets are the European Union and Turkey.
UKRAINE
The production is forecast to rise 5 percent to 113,000 tons due to higher yields. The majority of walnuts are produced by small private farms not typically applying inputs such as fertilizers or using mechanical harvesters. These growers typically sell to intermediaries, who assemble batches destined for domestic or overseas wholesale markets. Because these producers are not actively investing in their plantations, higher demand has been supplied by commercial expansion. In fact, area harvested by commercial growers has risen steadily since 2009 and now accounts for nearly one quarter. With higher available supplies, exports to China and the European Union are forecast to rebound.
TURKEY
The production is forecast to ease 5 percent to 58,000 tons as yields decline following drought, hail and frost in certain areas. Although walnuts are grown throughout the country, imports supply about two- thirds of domestic consumption and are expected to gain 5 percent and reach 110,000 tons. Walnuts are commonly used in desserts but are increasingly being purchased by health-conscious consumers as a snack.
WALNUTS SUMMARY
Metric tons, in-shell basis
| 2012/13 | 2013/14 | 2014/15 | 2015/16 | 2016/17 | Oct 2017/18 | |
| Production | ||||||
| China | 720000 | 780000 | 90000 | 1000000 | 1060000 | 1000000 |
| USA | 450871 | 446335 | 518003 | 549754 | 622329 | 589670 |
| Chile | 53000 | 60000 | 81634 | 80000 | 117000 | 120000 |
| Europe | 110000 | 110000 | 107900 | 117928 | 116670 | 115000 |
| Ukraine | 96940 | 115790 | 102740 | 115080 | 108000 | 113000 |
| Turkey | 85000 | 75000 | 40000 | 60000 | 63000 | 58000 |
| India | 36000 | 43000 | 35000 | 33000 | 32000 | 35000 |
| Other | 31000 | 30800 | 40500 | 37500 | 39500 | 39000 |
| Total | 1582811 | 1660925 | 1825777 | 1993262 | 2158499 | 2069670 |
| Domestic Consumption | ||||||
| China | 812200 | 854300 | 956400 | 1075200 | 1089600 | 1050000 |
| Еurope | 230200 | 262100 | 278500 | 310228 | 355670 | 360000 |
| Тurkey | 117500 | 115100 | 101100 | 142500 | 159200 | 163000 |
| USA | 154266 | 154922 | 140532 | 134543 | 190778 | 150451 |
| India | 24900 | 26400 | 32700 | 43400 | 46200 | 54000 |
| Japon | 27700 | 29000 | 38000 | 40400 | 46000 | 50000 |
| Ukraine | 38940 | 40590 | 43140 | 39380 | 51600 | 38100 |
| South Korea | 28200 | 29100 | 33900 | 30500 | 32100 | 35000 |
| United Arab Emirates | 8100 | 17100 | 14300 | 15100 | 32600 | 30000 |
| Canada | 20700 | 22200 | 17900 | 24000 | 25300 | 26500 |
| Other | 106700 | 107800 | 102941 | 116050 | 100068 | 108050 |
| Total | 1569406 | 1658612 | 1759413 | 197101 | 2129116 | 2065101 |
| Ending stock | ||||||
| Europe | 40000 | 35000 | 35000 | 40000 | 40000 | 40000 |
| USA | 41629 | 34988 | 75760 | 59121 | 50781 | 35000 |
| India | 5300 | 8100 | 16300 | 12800 | 17000 | 23000 |
| Тurkey | 5000 | 5000 | 4000 | 5500 | 6800 | 3800 |
| Ukraine | 1500 | 1500 | 1500 | 1400 | 1700 | 1600 |
| Other | 1200 | 900 | 593 | 443 | 400 | 400 |
| Total | 94629 | 85488 | 133153 | 119264 | 116681 | 103800 |
| Exports | ||||||
| USA | 310329 | 313471 | 364101 | 445781 | 460101 | 475000 |
| Chile | 50500 | 57400 | 76800 | 78500 | 115000 | 118000 |
| Ukraine | 58000 | 75200 | 59600 | 75800 | 56100 | 75000 |
| Moldova | 25100 | 27100 | 36800 | 34100 | 34000 | 34000 |
| China | 16100 | 16700 | 14500 | 8300 | 19000 | 20000 |
| Еurope | 15000 | 24700 | 16500 | 18300 | 13500 | 15000 |
| Тurkey | 9600 | 12000 | 8000 | 6500 | 7600 | 8000 |
| Other | 18700 | 19200 | 13600 | 11300 | 9000 | 9500 |
| Total | 503329 | 545771 | 589901 | 678581 | 714301 | 754500 |
| Import | ||||||
| Еurope | 140200 | 171800 | 187100 | 215600 | 252500 | 260000 |
| Тurkey | 42100 | 52100 | 68100 | 90500 | 105100 | 110000 |
| China | 108300 | 91000 | 70900 | 83500 | 48600 | 70000 |
| Japon | 27700 | 29000 | 38000 | 40400 | 46000 | 50000 |
| South Korea | 28200 | 29100 | 33900 | 30500 | 32100 | 35000 |
| India | 200 | 600 | 10400 | 14300 | 23200 | 30000 |
| United Arab Emirates | 8100 | 17100 | 14300 | 15100 | 32600 | 30000 |
| Canada | 20800 | 22600 | 22600 | 24500 | 25800 | 27000 |
| Irak | 11200 | 13700 | 11900 | 19500 | 19100 | 20000 |
| USA | 10885 | 15417 | 27402 | 13931 | 20210 | 20000 |
| Israel | 9600 | 9600 | 10700 | 13000 | 13400 | 14000 |
| Аustralia | 10600 | 12200 | 12400 | 11200 | 11600 | 13000 |
| Меxico | 7400 | 6300 | 9600 | 13800 | 9200 | 10000 |
| Brazil | 8000 | 8300 | 7100 | 8200 | 9000 | 9500 |
| Taiwan | 7300 | 6400 | 8300 | 8900 | 8000 | 9000 |
| Other | 51000 | 49100 | 38500 | 39800 | 25925 | 29550 |
| Total | 491585 | 534317 | 571202 | 642731 | 682335 | 737050 |
Sourse: https://www.fas.usda.gov/data/tree-nuts-world-markets-and-trade